Monitoring with colibri-sdk-go and OpenTelemetry

Learn in minutes how to instrument your Go services with colibri-sdk-go and OpenTelemetry. Spin up the stack with docker-compose, configure environment variables, and visualize your traces in Jaeger — with practical examples, real-world modules, and tips for end-to-end observability best practices.
Example Structure
-
Example modules:
- school-module
- financial-module
-
Support services (dev/):
- otel-collector
- localstack
- postgres
Prerequisites
- Docker and Docker Compose
- Go 1.24+
- Make
How to spin up the observability environment
The example project already provides a docker-compose with the necessary services ready for use.
- Clone the repository:
git clone https://github.com/colibriproject-dev/colibri-sdk-go-examples.git
- Compile the projects with the command:
make build
- Start the infrastructure services with the command:
make start
- Access Jaeger at http://localhost:16686/
OpenTelemetry Configuration in the SDK
The colibri-sdk-go SDK already includes OTel integration. See the file:
The example modules consume this configuration. Upon starting each service, the SDK initializes the trace provider and exporters according to the environment variables.
Relevant environment variables (examples)
OTEL_EXPORTER_OTLP_ENDPOINT: point to the Collector (e.g., http://otel-collector:4317)OTEL_SERVICE_NAME: service name (e.g., school-api)OTEL_RESOURCE_ATTRIBUTES: extra attributes (e.g., deployment.environment=dev)COLIBRI_LOG_LEVEL: log level
Check the .env files in each module:
- school-module/.env
- financial-module/.env
Generating tracing
- Create a course in the school-module:
curl --request POST \
  --url http://localhost:8080/public/v1/courses \
  --header 'Content-Type: application/json' \
  --data '{"name": "Course 001","value": 100}'
- With the ID returned from the course creation, execute a search:
curl --request GET --url http://localhost:8080/public/v1/courses/fe6fa672-8ce0-11f0-a8e8-a3ca18a3537e
-
For more requests, see the project documentation:
- School Swagger UI: http://localhost:8080/swagger/index.html
- Financial Swagger UI: http://localhost:8081/swagger/index.html
-
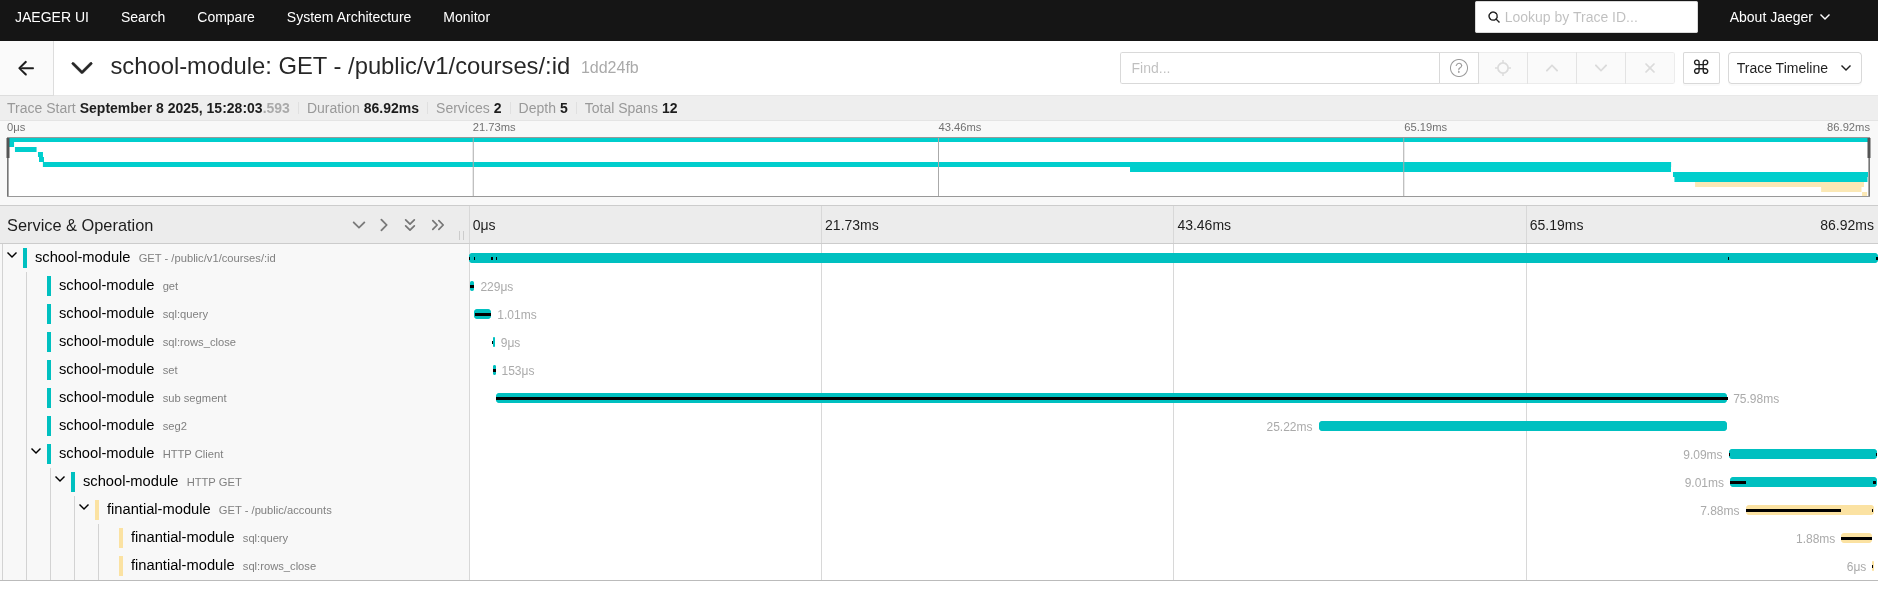
Access Jaeger at http://localhost:16686/ and see the generated traces.
Exploring metrics and traces
Example tracing for the REST call to search for a course by ID:
Best practices
- Name
OTEL_SERVICE_NAMEby module to facilitate filtering. - Propagate
context.Contextthroughout the entire call stack. - Attach key attributes (user_id, order_id) as span attributes when relevant.
- Set appropriate sampling in the Collector for production environments.